Quick - start LUMETRIC
Process in snapshots for the first steps below.
Goal: This section gives you an example of a simple FRET experiment with live plotting. The provided pictures can only serve as an orientation what to look for. Precise naming of configurations, presets and similar depend on your system setup.
- Open your MicroManager Instance.
- Make sure your config file is correct.
- Set your basic Presets and Settings. Focus your cells.
- Open LUMETRIC via your Quick Access Button.
- Configure the sequence table (one or multiple rows). Select your 'Save' - folder and Name your experiment.
- Go to Tab 3 – Data Visualization
- Choose your mode (spatial/ temporal)
- Configure graphs: each Intensity or Ratio, which Row, which window
- (Optional) Enable Background correction
- Click OK – Start Acquisition
- Draw ROIs in Acquisition Window
- Measure
- Quit and check export
Process as snapshots
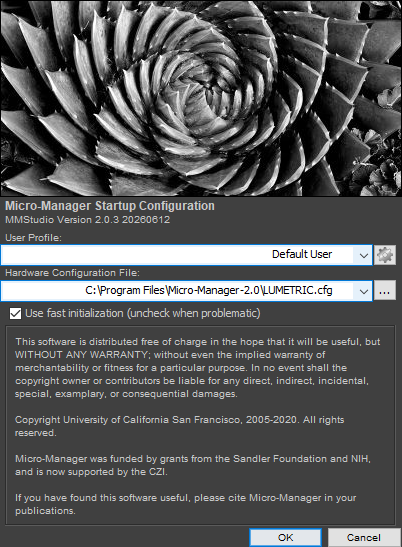
Fig.1: Make sure your config file is correct.
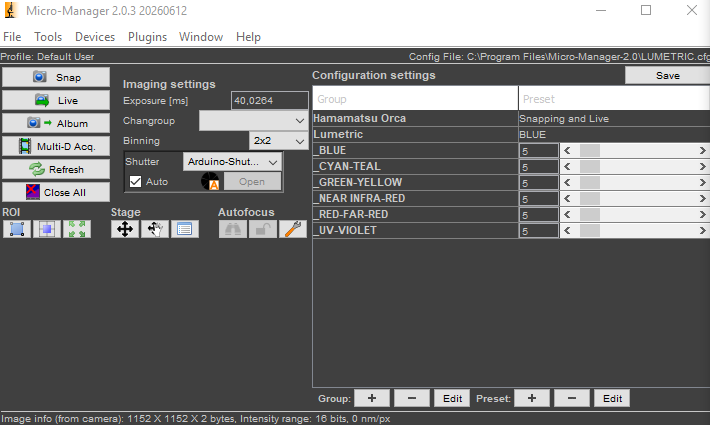
Fig.2: Set your basic Presets and Settings. Focus your cells.
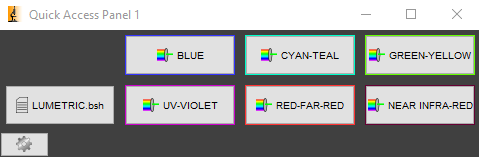
Fig.3: Open LUMETRIC via your Quick Access Button.
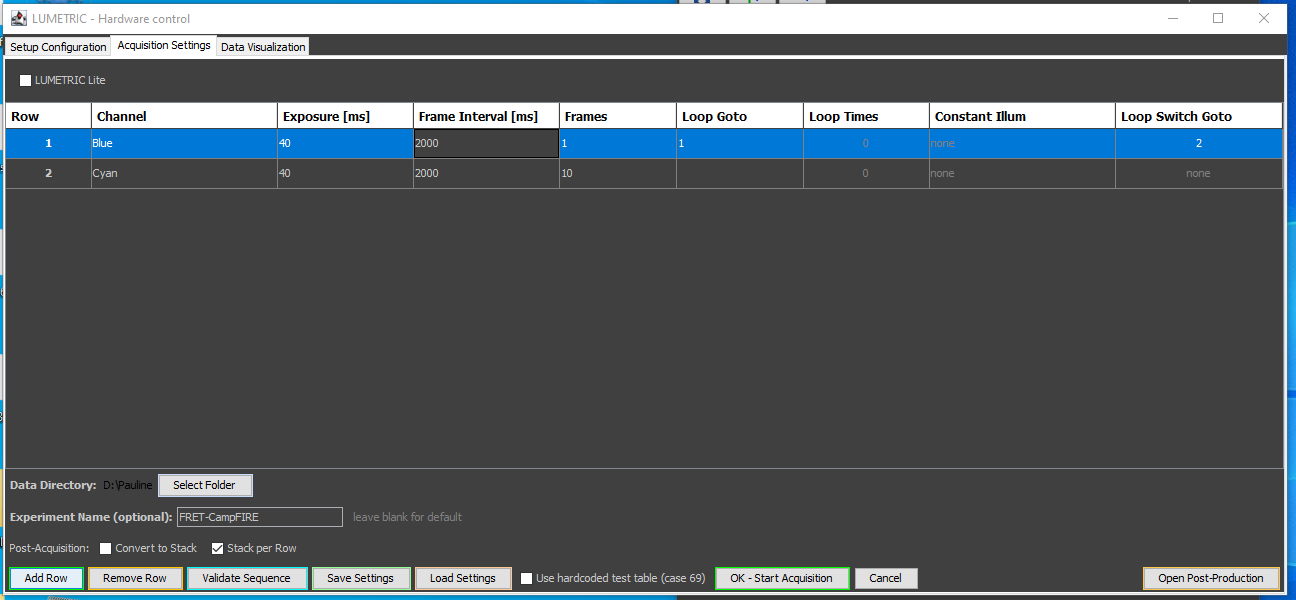
Fig.4: Configure the sequence table (one or multiple rows). Select your 'Save' - folder and Name your experiment.
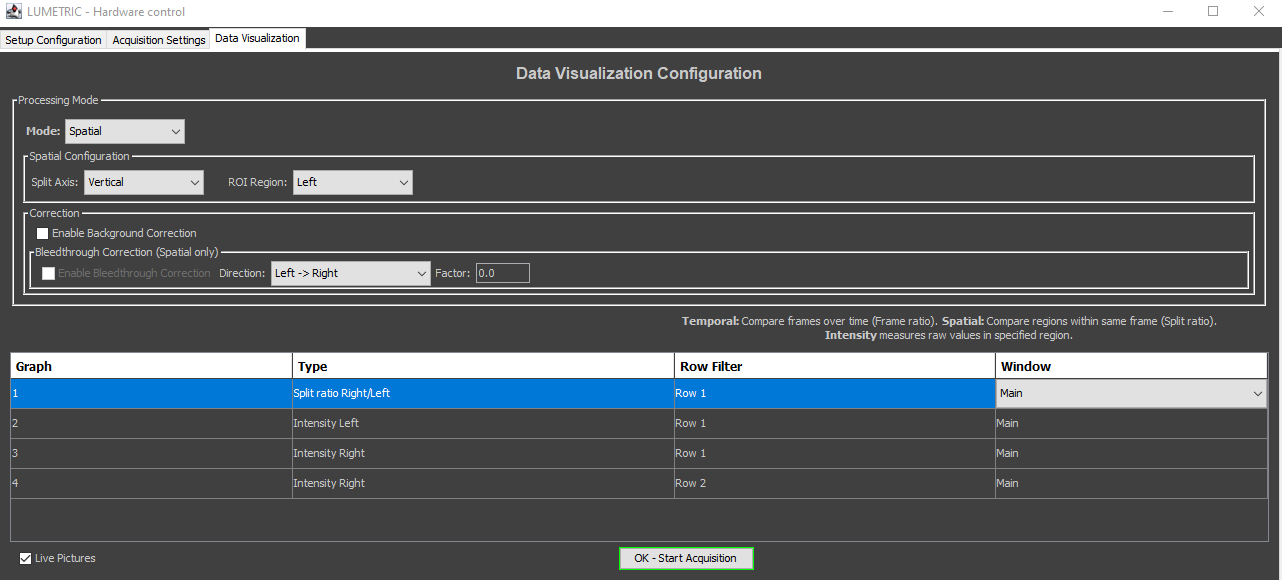
Fig.5: Tab 3 - Spatial mode.
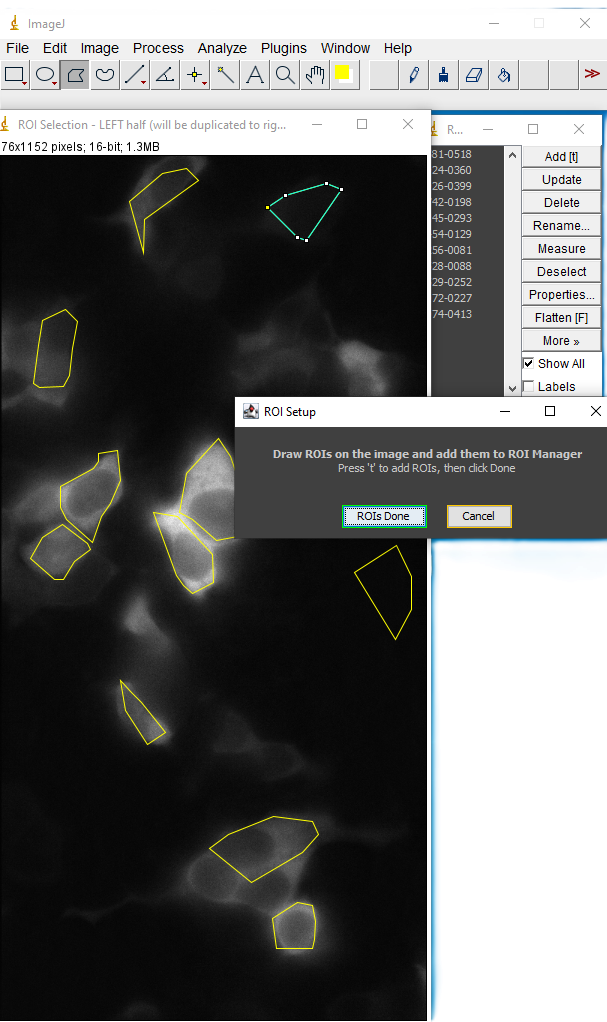
Fig.6: ROI selection.
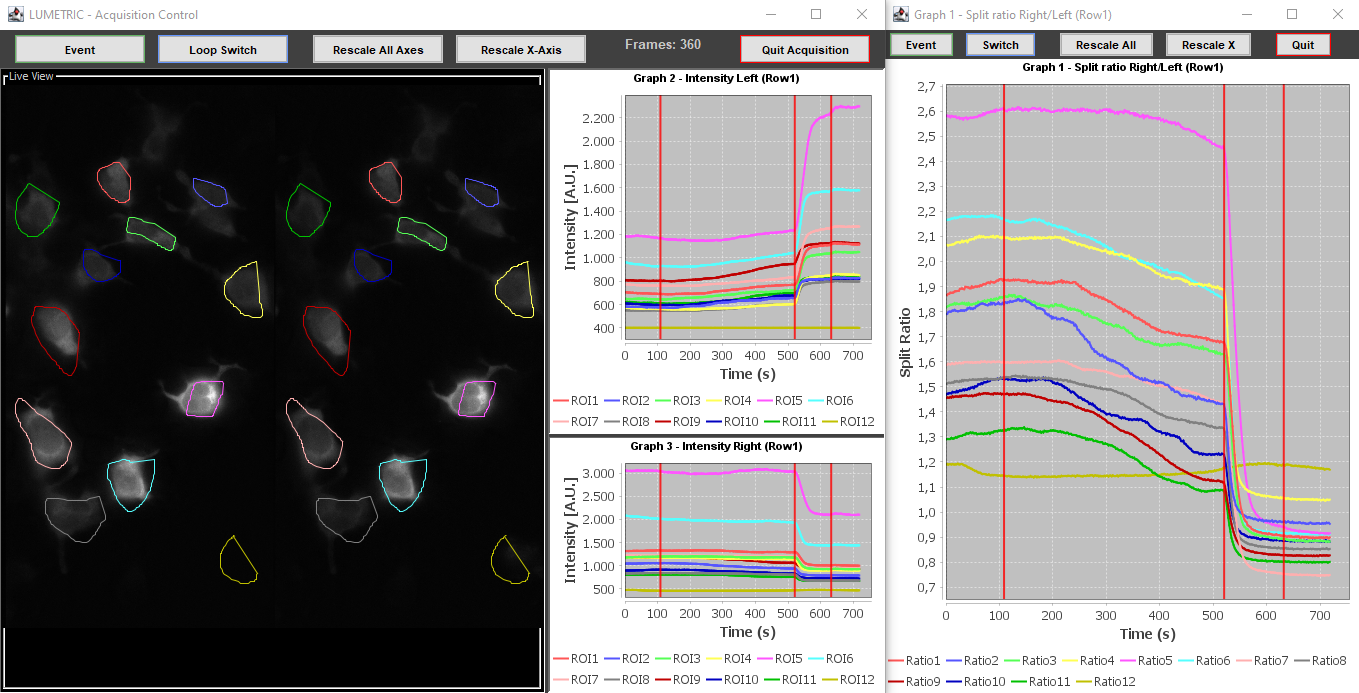
Fig.7 Aquisition Window - Set to Ratio in an extra window.